As John von Neumann wrote in 1947, “truth… is much too complicated to allow anything but approximations”. When we started modelling COVID-19 in January, this adage became undoubtably relevant to 2020. Not only did the key epidemiological characteristics of COVID-19 have to be estimated (e.g., its reproductive number, symptomatic fraction, and recovery period), but the very nature of the disease’s transmission remained elusive. Were asymptomatic patients infective? Did the disease transmission vary across social contexts? To what extent was physical distancing effective in curbing the transmission? We needed to find acceptable answers and quantify feasible interventions as quickly as possible. The idea was to extend our pandemic agent-based model (ABM), previously calibrated to influenza, and utilize its high-resolution demographic and mobility layers in constructing a digital twin for Australia.
As the pandemic unfolded around the world, some invariants started to emerge. In the weeks and months before government interventions shaped each nation's epidemic curves, many countries exhibited a rapid growth rate in cumulative incidence, averaging in the range of 0.2–0.3 per day. Australia experienced comparable growth during March 2020, prior to travel and social distancing restrictions. Estimates of the reproductive number also started to stabilise. The first international reports on paediatric patients added further information, emphasising a markedly low rate of SARS-CoV-2 transmission in children. Yet, the various known targets in our model were not locking in place, conflicting with each other and making the calibration challenging.
Some approximations just had to be made, whilst retaining our focus on actionable interventions. It was only when we explored the ratio of symptomatic cases in children within a much lower range than the one in adults that the model finally clicked and produced a robust baseline scenario agreeable with known epidemic parameters.
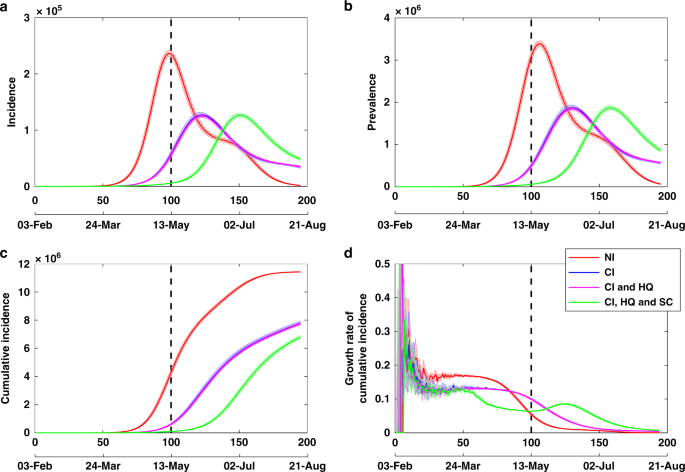
The next step was making the model useful by specifying various intervention scenarios, setting macro- and micro-distancing parameters, and shaping mitigation and suppression strategies. Each social distancing scenario assumed specific, reduced, micro-level interactions within communities, workplaces and schools, applied across a macro-slice of compliant population. We leveraged cluster computing to vary these parameters – as well as a host of other factors – and identified a tipping point: the minimal level of effective social distancing (80%). Finding such a clear and easily interpretable outcome, despite following the “same storm, different boats” ABM approach, was particularly rewarding.

Figure 1. Tipping point in social distancing compliance in the 70-80% range. Social distancing at 80% and above effectively controls the disease during a 13-week suppression period (grey shaded area), while lower levels (at 70% or less) do not succeed for any duration of the suppression (case isolation, home quarantine, and international travel restrictions are applied as well).
An early preprint followed, immediately attracting a lot of public interest and much needed social engagement. Our email inboxes exploded to over a thousand emails in several days. The secondary role played by school closures was particularly controversial, with many preconceptions rooted in the influenza experiences. Many correspondents suggested even more refined agents and social interactions. Did the model account for cruise ships? Were in-hospital transmissions modelled differently? What about families with teacher-nurse relationships? The only satisfactory response to this deluge is to paraphrase George Box: “All models are wrong, but some are useful”. As the fight against COVID-19 continues, we hope that many contentious and rhetoric-rich debates can be resolved by sharp quantitative modelling.

Figure 2. A comparison between actual epidemic curves in Australia and a simulation scenario with 90% of the population following social distancing (SD) during a 13-week period (grey shaded area), coupled with case isolation, home quarantine, and international travel restrictions. An ensemble of 20 simulation runs (yellow colour) is centred on average (solid), within 95% confidence interval (thin solid) profiles. The model was calibrated by 24 March 2020.
Our paper is available at: https://www.nature.com/articles/s41467-020-19393-6


Please sign in or register for FREE
If you are a registered user on Research Communities by Springer Nature, please sign in